Enterprise Risk and Resilience
Higher Education Risk Assessment Tool
This tool will help you consider your campus' risk portfolio for a specified list of the most common risks in higher education.
The purpose of this tool is not to ensure all risks are rated as "Adequately Controlled" but rather to help departments assess their control structure for sufficiency given their environment, resources, and bandwidth. This tool will not make decisions for you, but it will help you organize your thinking as you consider your campus' risk profile and related enterprise risk management implications.
The steps involved in completing this tool are outlined below, followed by additional notes.
- Step 1. Get started
- Step 2. Customize scales and weightings
- Step 3. Assess your risks
- Step 4. Review a chart of your risks
- Step 5. Export your data
Download a sample version of this tool (xlsx)
View the Higher Education Risk Assessment Tool Webinar
The sample version should allow you to understand how this tool displays information, how to navigate through the steps, and what types of information you will need to complete it. However, it does not contain any formulas or calculations.
The full version of this tool is available free of charge as a public service and outreach effort of the UCOP Office of Risk Services. However, we do ask that you provide us with some basic information to assist us in understanding how this tool is being used. This helps us ensure we are continuously evolving the tools in our toolkit to meet the needs of our users.
If you would like a full version of this tool, please contact us at erm@ucop.edu with the following information:
- Your name and title
- Your organization
- Your phone number
- Your e-mail address
- The name(s) of the tool(s) you would like to use
- A brief description of how you intend to use the tool(s)
Step 1. Getting Started
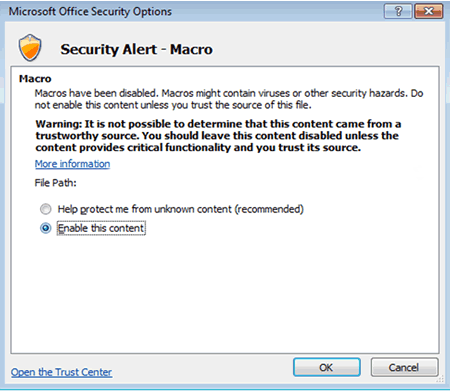
When you open the tool, you may be prompted with a warning indicating some content is unsecured. The tool only uses one macro, which allows the data export function to work. You will be able to fully utilize the tool even if you do not enable this macro; however, you will not be able to export the data without enabling it.
![]()

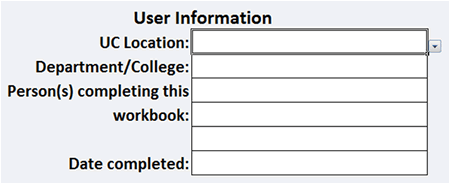
Next, fill in the employee names and organization information at the top of the first page. Then save the file in a secure location with an appropriate, unique name. This will minimize confusion if multiple files are created.

Then click the “Get Started!” button below the introduction to move on to the next step.
Step 2. Customize Scales and Weighting
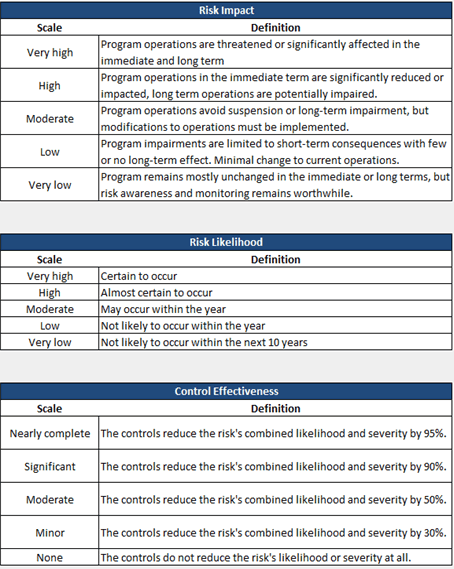
Before you begin rating the risks involved and assessing your controls, it is necessary to set some common definitions for the varying degrees of a risk's impact and likelihood. It is also important to set common parameters for evaluating the effectiveness of controls. Sample definitions are provided as shown in the following tables. Place your cursor in the definition field to modify the definitions to suit your needs.

Risk impact and risk likelihood are both weighted at 50% each by default as shown in the following table. Depending on the types of risk you are considering, those weights may change. For instance, if you are using this tool to consider risks that could cause workers’ compensation claims, you may weigh risk likelihood higher because there are statutory limits that determine the severity of the claims based on frequency. If instead you are considering reputational risks, where small number events may have a significant impact, you may weigh severity higher. To change how these factors are weighed, place your cursor in the cell and revise the percentages. These two factors must be equal to 100%.

As you move on to other steps, you can return to this page at any time by clicking the "Customize Scales" button
Step 3. Assess your risks
Formula Protection
Some cells on each page are protected to prevent accidental edits which may affect the tool’s calculations. Cells containing formulas are shaded a light grey. Spaces intended to be left blank are also shaded in the same light grey. Cells where you can enter information or make a selection from a drop-down menu are filled in white. Even for cells that are protected, you are able to format cells as you wish (change fonts, styles, colors, widths, heights, alignment, and text wrapping). These types of changes should be made without removing the protection on the page.
Risk Assessment
This step lists common risks related to higher education, which are organized in the following groups:
- Hazard Risks
- Financial Risks
- Information Technology Risks
- Human Resources Risks
- Research Risks
- Contract and Grant Risks
- Campus Life Risks
- Facilities & Maintenance Risks
There are blank spaces at the bottom of the page to list additional risks at your discretion.
Assess the impact and likelihood of each risk listed by selecting a scale from each dropdown menu. Next, describe how your organization is currently managing each risk, and describe any risk mitigation plans or efforts which are already in place. Then identify how frequently controls for that risk are performed. For example, an audit may be performed annually, whereas access badges that restrict access to certain areas of the campus or medical center may be used multiple times daily.
Assess the effectiveness of the existing controls you just described by selecting a scale from the dropdown menu in the “Control Effectiveness” column. Once you have made this selection, the risk rating will be calculated and the “Risk Rating” field will populate.
This “Risk Rating” will show as one of the following:
| Risk Rating | Meaning |
|---|---|
|
Potentially over-controlled |
Management should review these risks to determine if controls need to be modified and make changes appropriately. |
|
Adequately controlled |
No immediate action is required. |
|
Potentially poorly controlled |
Management should review these risks to determine if controls need to be modified and make changes appropriately. |
|
Poorly controlled |
These risks should receive immediate attention. |
If you want to change the options shown on the dropdown menus for "Risk Impact", "Risk Likelihood", or "Control Effectiveness" you can change them by returning to the "Customize Scales" step.
Then, under "Dashboards, Monitoring, & Reporting," describe how the control activities are being monitored and identify the person in your organization who is accountable for monitoring those controls.
Step 4. Review a chart of your risks
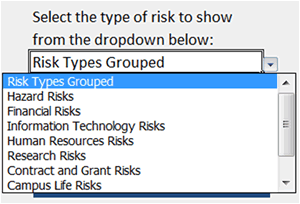
The chart provides a graphical representation of your risk assessment based on your selections for risk likelihood, risk impact, and control effectiveness. There is a dropdown menu at the left of the page which allows you to select which information to plot on the chart. You can have the chart show each risk of a selected group or each group combined as a single point displayed with the other groups.

Step 5. Export your data
When you have completed all of the steps, you may export the data into a comma-separated value file (.csv) for use in the University's Enterprise Risk Management Information System (ERMIS) by selecting the "Export" button in the Assess Risk step.

