Enterprise Risk and Resilience
Control Structure Assessment Tool
This tool builds upon other risk assessment tools to help you consider not only the impact and likelihood for a selected list of risks, but also help you evaluate the effectiveness of current controls and whether any changes may be required to bring the list of risks within your risk appetite.
The purpose of this tool is not to ensure all risks are rated as "Adequately Controlled" but rather to help departments assess their control structure for sufficiency given their environment, resources, and bandwidth. This tool will not make decisions for you, but it will help you organize your thinking as you consider your organization's risk profile and related enterprise risk management implications.
The steps involved in completing this tool are outlined below, followed by additional notes- Step 1. Get started
- Step 2. Customizable Scales and Weighting
- Step 3. Risk Assessment
- Step 4. Additional Controls
- Step 5. Chart of Risks
- Step 6. Export your data
Download a sample version of this tool (xls)
View the Control Structure Assessment Tool Webinar
The sample version should allow you to understand how this tool displays information, how to navigate through the steps, and what types of information you will need to complete it. However, it does not contain any formulas or calculations.
The full version of this tool is available free of charge as a public service and outreach effort of the UCOP Office of Risk Services. However, we do ask that you provide us with some basic information to assist us in understanding how this tool is being used. This helps us ensure we are continuously evolving the tools in our toolkit to meet the needs of our users.
If you would like a full version of this tool, please contact us at erm@ucop.edu with the following information:
- Your name and title
- Your organization
- Your phone number
- Your e-mail address
- The name(s) of the tool(s) you would like to use
- A brief description of how you intend to use the tool(s)
Step 1. Getting Started
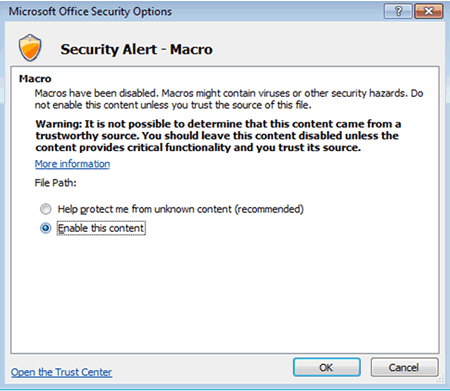
When you open the tool, you may be prompted with a warning indicating some content is unsecured. The tool only uses one macro, which allows the data export function to work. You will be able to fully utilize the tool even if you do not enable this macro; however, you will not be able to export the data without enabling it.
![]()
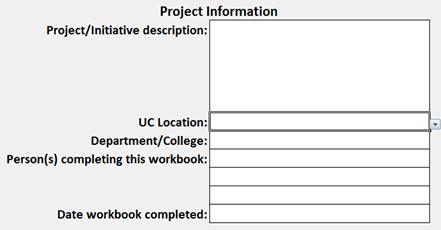
Next, fill in the project information section at the top of the first page. Then save the file in a secure location with an appropriate, unique name. This will minimize confusion if multiple files are created.
Step 2. Customizable Scales and Weighting
Before you begin describing the risks involved and assessing your controls, it is necessary to set some common definitions for the varying degrees of a risk's impact and likelihood. It is also important to set common parameters for evaluating the effectiveness of controls. Sample definitions are provided as shown in the following tables. Place your cursor in the definition field to modify the definitions to suit your needs.
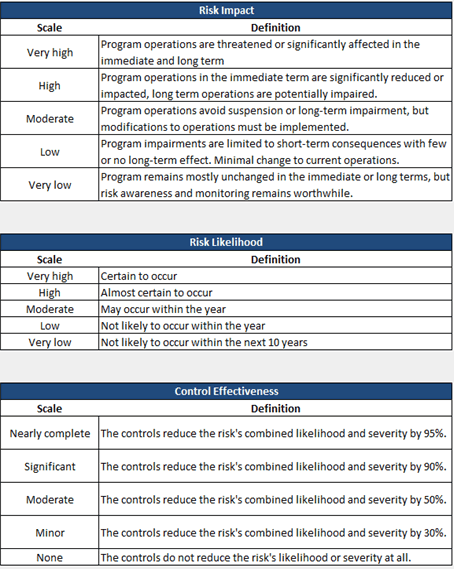
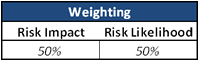
Risk impact and risk likelihood are both weighted at 50% each by default as shown in the following table. Depending on the types of risk you are considering, those weights may change. For instance, if you are using this tool to consider risks that could cause workers’ compensation claims, you may weigh risk likelihood higher because there are statutory limits that determine the severity of the claims based on frequency. If instead you are considering reputational risks, where small number events may have a significant impact, you may weigh severity higher. To change how these factors are weighed, place your cursor in the cell and revise the percentages. These two factors must be equal to 100%.
As you move on to other steps, you can return to this page at any time by clicking the "Customize Scales" button
Step 3. Risk Assessment
Formula Protection
Some cells on each page are protected to prevent accidental edits which may affect the tool’s calculations. Cells containing formulas are shaded a light grey. Spaces intended to be left blank are also shaded in the same light grey. Cells where you can enter information or make a selection from a drop-down menu are filled in white. Even for cells that are protected, you are able to format cells as you wish (change fonts, styles, colors, widths, heights, alignment, and text wrapping). These types of changes should be made without removing the protection on the page.
In the "Additional Controls" step, if you decide to change the description of a risk or current management and mitigation, return to the Risk Assessment step and make the change there. The new description will then be reflected in the "Additional Controls" step.
Risk Assessment
First, describe each risk and the potential consequences of control failure. There is space for 45 different risks to be listed. In describing the risks, be brief. These descriptions are used later in plotting the risks on a chart. If you want to describe potential adverse events in more detail, the “Potential Consequences of Control Failure” column is appropriate. Alternatively, you also have the option to use risk reference numbers on the chart instead of the risk description.
Next, apply the scale which most closely matches the impact and likelihood of the risk from the dropdown menus in the next two columns. Risk impact and likelihood should be rated assuming there are no controls in place. These selections are used in calculating the risk rating, and they use the scales you created in the previous page.
Next, describe how your organization is currently managing each risk, and describe any risk mitigation plans or efforts which are already in place.
Assess the effectiveness of the existing controls you just described by selecting a scale from the dropdown menu in the “Existing Control Effectiveness” column. Once you have made this selection, the risk rating will be calculated and the “Risk Rating with Existing Controls ” field will populate.
This “Risk Rating with Existing Controls” will show as one of the following:
| Risk Rating | Meaning |
|---|---|
|
Potentially over-controlled |
Management should review these risks to determine if controls need to be modified and make changes appropriately. |
|
Adequately controlled |
No immediate action is required. |
|
Potentially poorly controlled |
Management should review these risks to determine if controls need to be modified and make changes appropriately. |
|
Poorly controlled |
These risks should receive immediate attention. |
Finally, select “yes” or “no” from the drop down menu in the last column to determine whether the risk will be plotted on the chart. This allows you to prevent the chart from becoming cluttered with too many points displayed.
Additional Controls
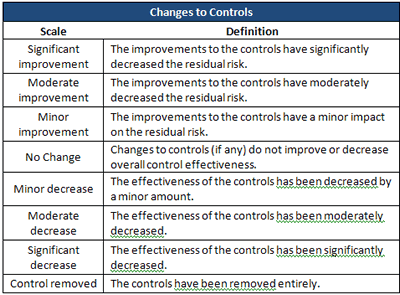
The first three columns, “Risks”, “Current Management and Mitigation”, and “Risk Rating with Existing Controls” are automatically populated based on your input from the Risk Assessment step. Describe any changes to the controls and decide how those changes impact the effectiveness of the controls by selecting from the dropdown in the next column. Your possible choices are outlined in the table below.
Once you have made this selection, the risk rating will be calculated and the “Risk Rating after Changes to Controls” field will populate with one of the ratings described in the Risk Assessment step. (Potentially over-controlled, Adequately controlled, Potentially poorly controlled, or Poorly controlled.)
The final column allows you to assign the responsibility for overseeing or implementing changes to controls to an appropriate person or department.
Step 4. Chart of Risks
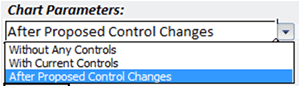
The chart provides a graphical representation of your risk assessment based on your selections for risk likelihood and risk impact. The dropdown menu in the “Chart Parameters” section will allow you to select which information to plot on the chart. For instance, you can have the chart show risk likelihood and risk impact without any controls, with your current controls (as described in the “Risk Assessment” step), or after the proposed control changes (as described in the "Additional Controls" step).
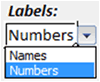
There is a dropdown menu under “Labels” which allows you to select how the information is labeled on the chart. You can have the chart label each risk using the corresponding number in the left-most column of the “Risk Assessment” step or the risk description (the first column you filled in in that step) by selecting “Names” instead.
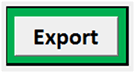
Step 5. Exporting your Data
When you have completed all of the steps, you may export the data into a comma-separated value file (.csv) to upload in the University's Enterprise Risk Management Information System (ERMIS) by selecting the "Export" button in the “Introduction” page .